Introducing WaveLabX: an open source toolkit for laboratory wave probe analysis
WaveLabX is an open source toolkit for incident reflected wave decomposition, with a shared Goda Suzuki spectral core in Python and a zero install browser app.
WaveLabX is a small piece of software we built to remove a quiet but real source of friction in coastal laboratory work: turning raw wave gauge records into trustworthy incident and reflected wave heights without re-implementing the same spectral decomposition every time, in every lab, in slightly different ways.
It is now public, MIT licensed, and citable.
- Live app: wave-lab-x.vercel.app
- Source: github.com/sandslamsal/WaveLabX
- DOI: 10.5281/zenodo.20347447
What it does
WaveLabX takes wave probe time series and returns:
- Zero crossing wave statistics from a single probe record
- Two probe Goda Suzuki frequency domain decomposition (incident vs reflected components on a co linear gauge pair)
- Three probe redundant array decomposition with validity filtering and a per frequency probe spacing check
- A retained energy diagnostic so you can see how much of the spectrum the decomposition actually trusts at the chosen geometry
Drop in a CSV with 2, 3, or 6 columns and the tool figures out which routine to run. The browser app shows a results table with an incident H, reflected H, and reflection coefficient K_r for each array, plus interactive time series, energy spectrum, and power spectrum plots.
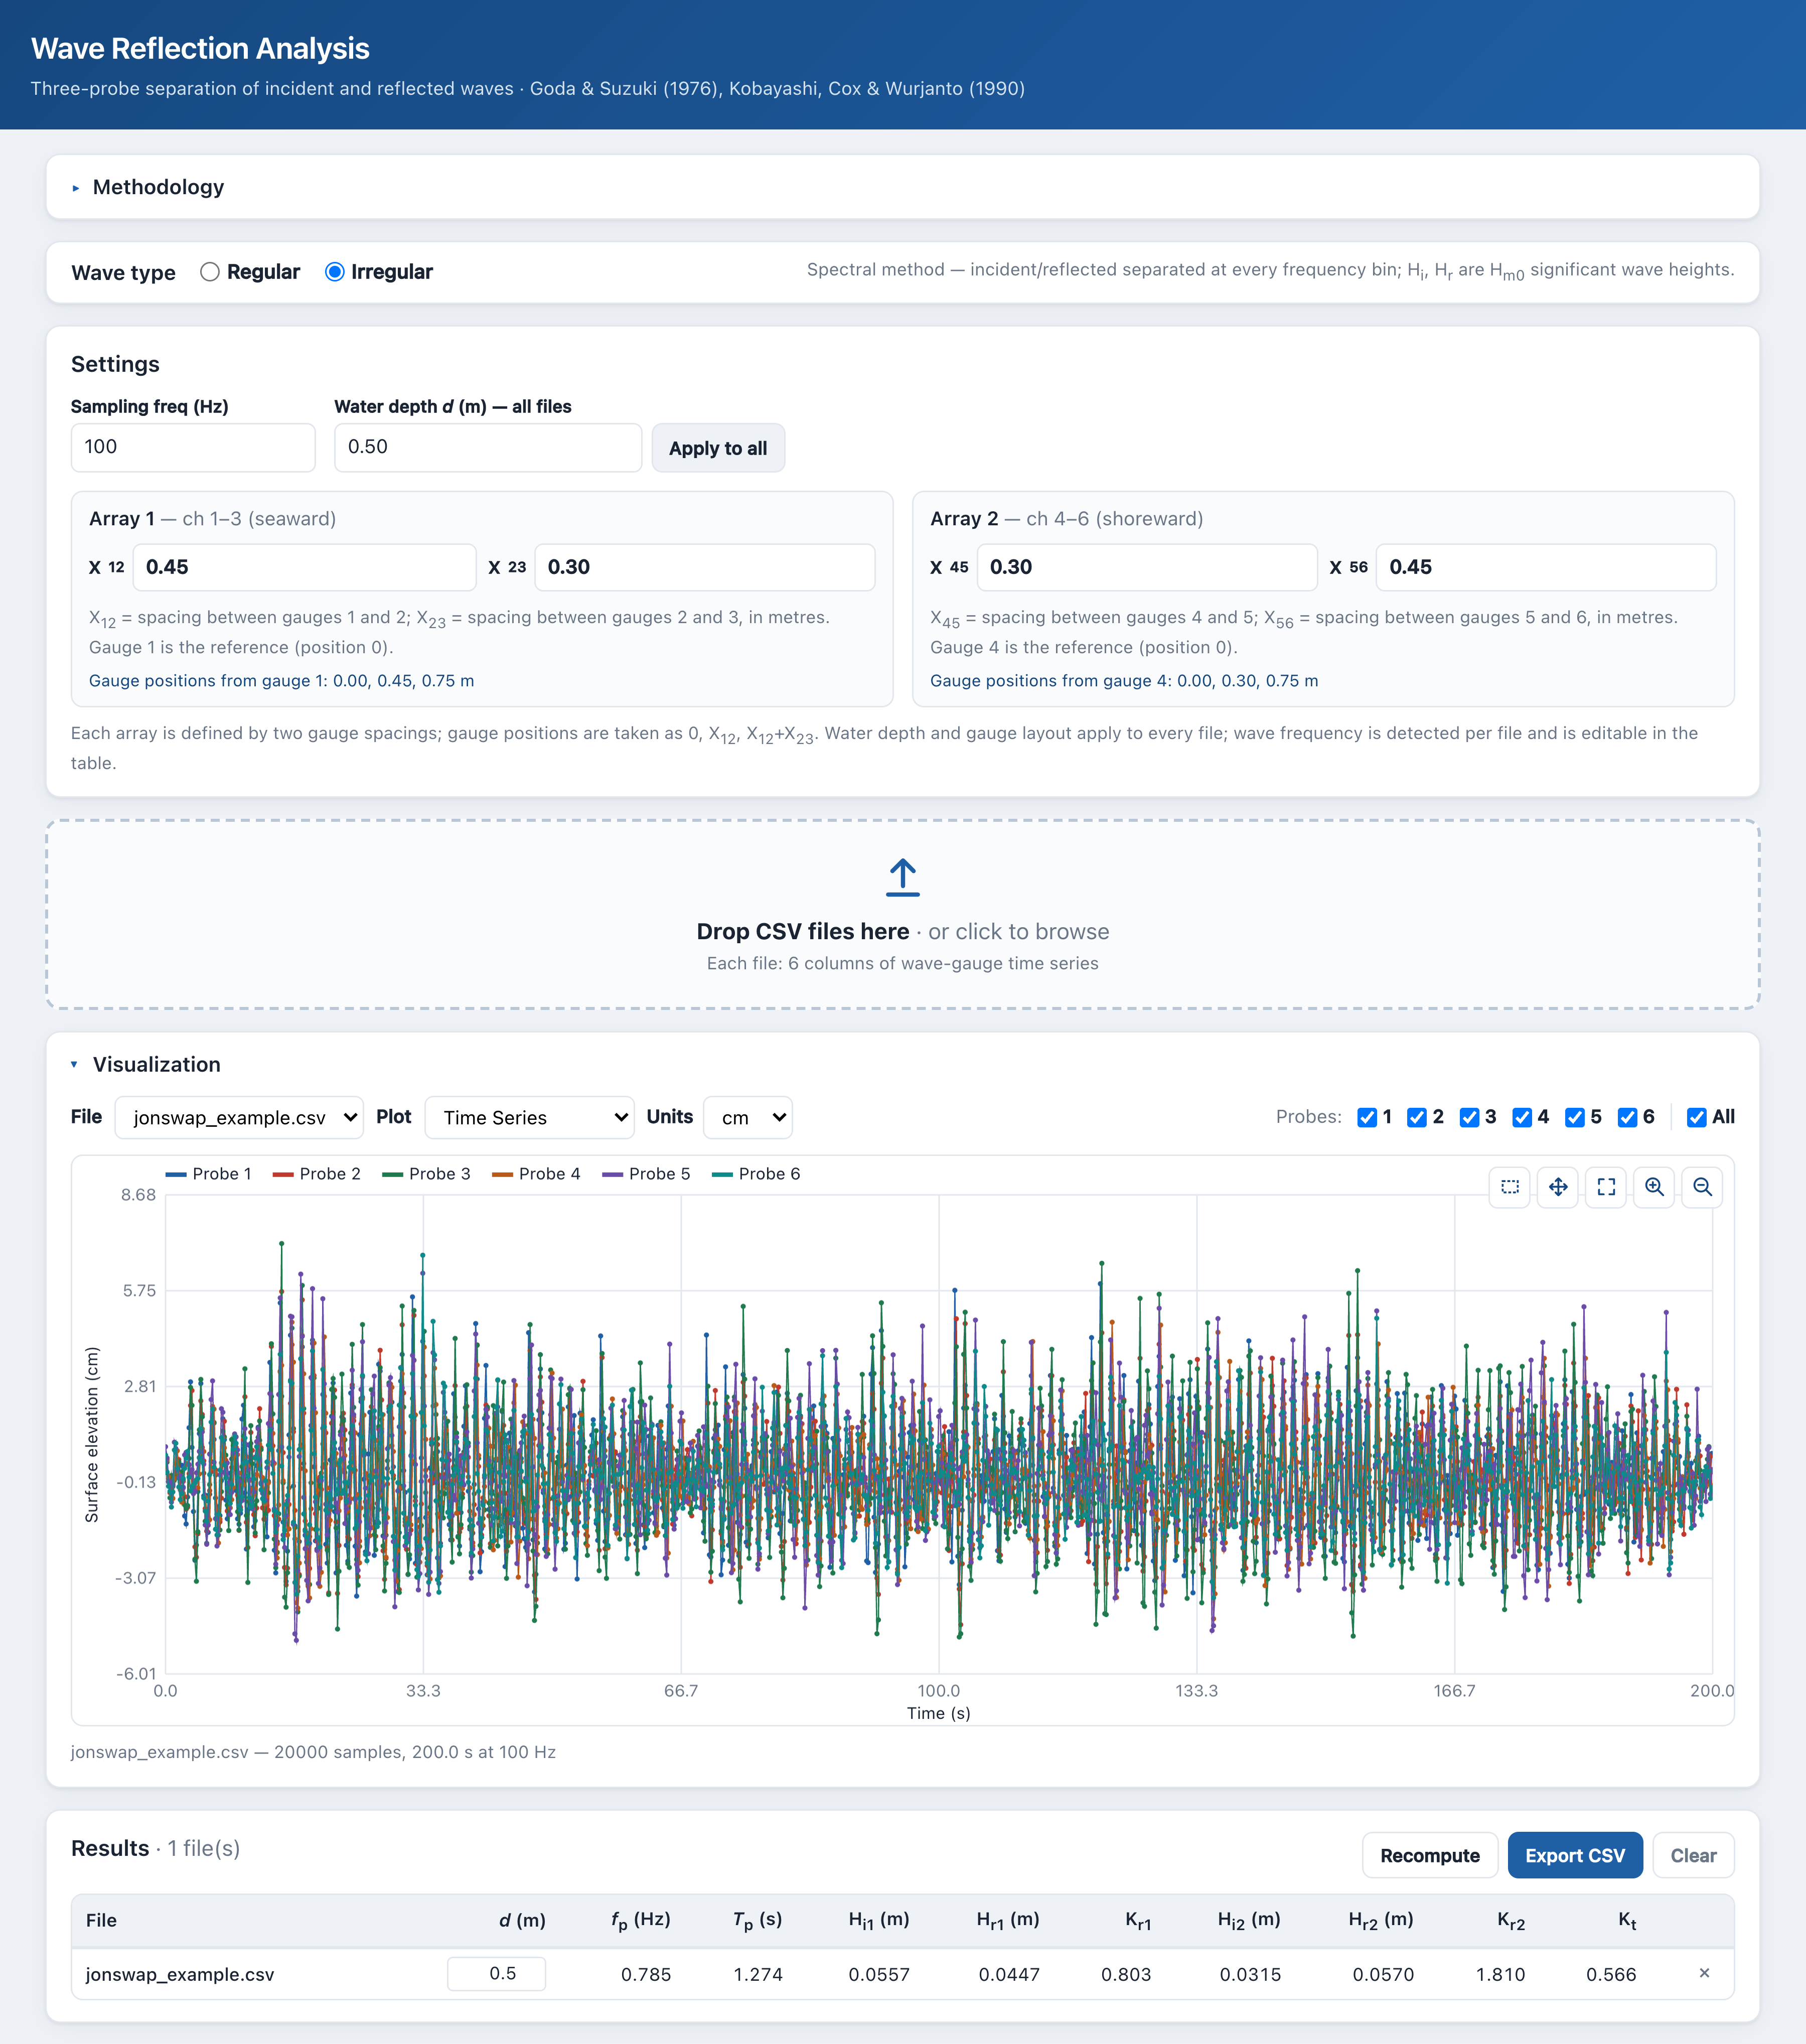
The WaveLabX browser app, running entirely client side.
Who it is for
Anyone running wave flume or basin tests where you need to separate incident and reflected waves: graduate students processing flume records, lab technicians validating a new probe array, reviewers who want to reproduce a number from a paper without setting up an environment. The browser version is also useful in a teaching setting, because the spectral machinery is no longer hidden behind a black box.
Architecture
The thing we cared most about during the build is something boring: one numerical core, two front ends, identical outputs. Lab software has a long history of “the Python version says X, the MATLAB version says Y, the spreadsheet says Z,” and we wanted to make that impossible by construction.
- Free-surface elevation η(t)
- 2–3 co-linear wave probes
- Sampling rate fs, depth h, probe positions xj
- Detrend each gauge record
- Real-input DFT → Aj(f)
- Dispersion ω² = gk·tanh(kh)
- Per-frequency incident + reflected fit
- Two-probe Goda–Suzuki
- Three-probe redundant array
- Spacing band 0.05 ≤ Δx/L ≤ 0.45
- Inversion conditioning cond(M)
- Retained-energy fraction
- Incident & reflected Hm0; Kr = Hr/Hi
- Incident / reflected spectra S(f)
- CSV export & publication figures
So WaveLabX ships as:
- A Python package (
wavelabx/) with the per frequency Goda Suzuki formulation, the three probe redundant array routine, and a high levelreflection_analysiswrapper that picks the right method per record. - A JavaScript module (
web/spectral.js) that mirrors the Python API one to one —twoProbeGoda,threeProbeArray,reflectionAnalysis— implementing the exact same per frequency formulation. - A browser UI (
web/index.html) that wires the JS core to a drag and drop interface, runs entirely client side, and never uploads your data anywhere. - A pytest suite with JS Python parity tests that feed the same synthetic inputs to both cores and assert numerical agreement, so the “same numbers, two languages” claim is mechanically enforced rather than aspirational.
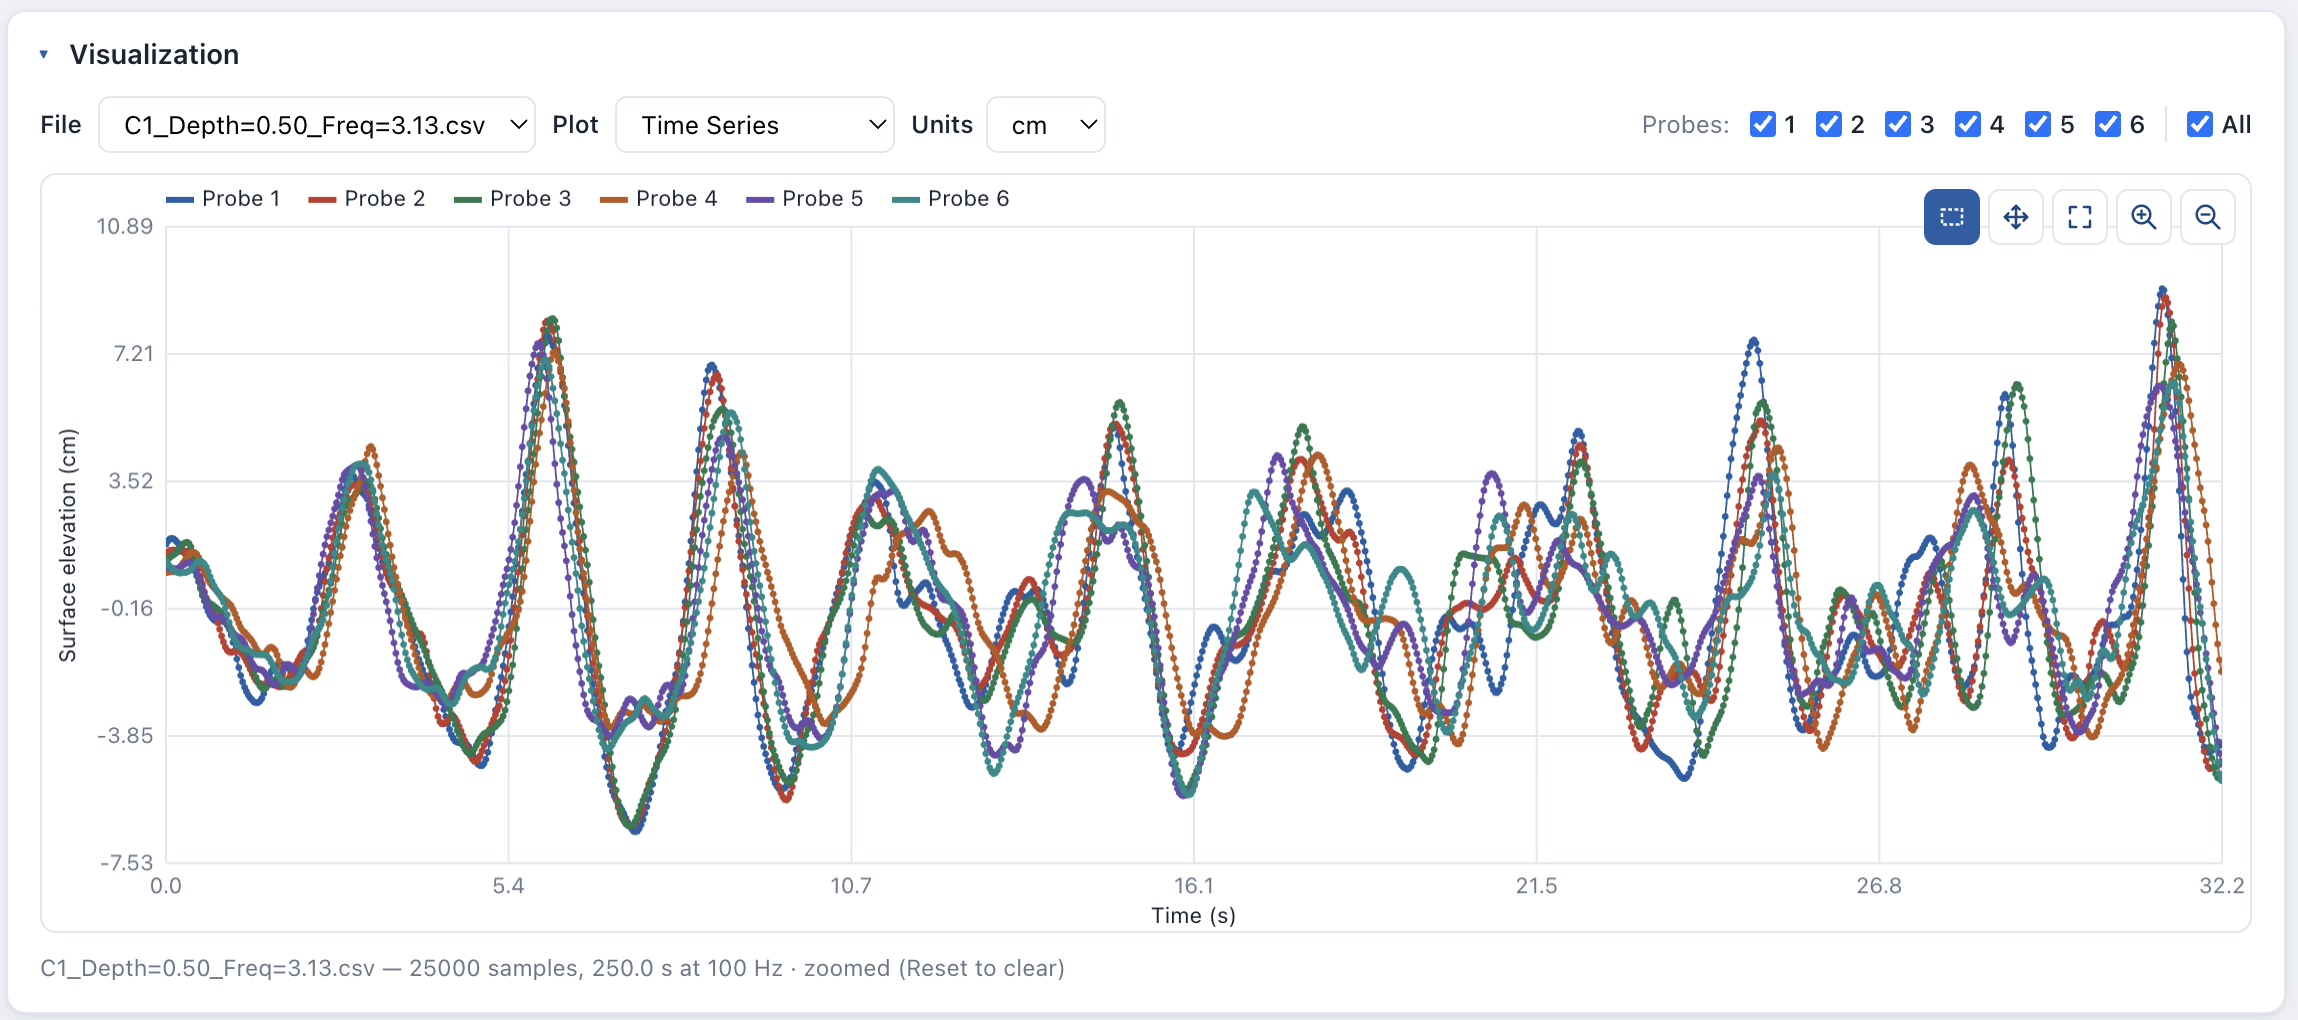
Interactive time series and spectral plots in the browser tool.
How it works, in one paragraph
The two probe and three probe methods share a single per frequency spectral formulation. The three probe routine averages the three valid probe pairs at each frequency; the high level wrapper runs the three probe routine, evaluates every two probe pair, and selects the three probe result when it retains at least 80% of the spectral energy, otherwise falling back to the best admissible two probe pair. Each result is tagged in the results table (and the exported CSV) as 3P or 2P, so you always know which path produced the numbers.
How to use it
In Python:
import numpy as np
from wavelabx import reflection_analysis

eta = np.loadtxt("data/wavedata.csv", delimiter=",", skiprows=1)
out = reflection_analysis(eta, fs=100.0, h=0.25, gpos=(0.0, 0.35, 0.70))
print(out["method_used"], out[out["method_used"]]["Kr"])
In the browser, drop the same CSV onto wave-lab-x.vercel.app. The column count auto detects the routine, and you can override the analysis method (Auto, three probe only, or any of the two probe pairs) from the Settings panel.
License and citation
WaveLabX is released under the MIT License. If you use it in research, please cite the archived release:
Lamsal, S., Deveaux Garrido, C., Haus, B. K., & Rhode-Barbarigos, L. (2026). WaveLabX (v0.3.1) [Software]. Zenodo. https://doi.org/10.5281/zenodo.20347447
Citation metadata is also provided in CITATION.cff in the repo.
What is next
Issues, ideas, and pull requests are welcome on the GitHub repository. The roadmap is intentionally short: more test coverage on real lab data, better diagnostics in the browser UI for borderline probe geometries, and clearer documentation around when to trust three probe averaging versus falling back to a two probe pair.
If you have a stubborn wave reflection record that you would like analyzed, drop it into the live tool and let me know how it goes.